Report Management
Overview
Oracle CPQ allows you to generate and store reports. You can generate reports on Commerce main document and line item attribute data. Reporting will return results based on user permissions.
A Report Manager is available for every Commerce Process in the system. Users can store, edit, run and manage reports in the Report Manager.
Use folders for organizing reports within the Report Manager. All users can choose to share their reports with other users. The other users can run the report on the transaction data that is available to them, depending on their user rights. Reports can be built from scratch or from saved views. When a report is run, the results generated are displayed in the UI. These results can also be downloaded to Microsoft Excel, or sent as an Excel attachment to an email.
 Example
You can specify filter attributes to generate report results. For example, you can create and run a report that will give you all the "Closed" quotes that have been created in the last 60 days. In this example, you specify the Date Created, Duration (Last 60 days), and Fulfill Status - Closed as the filters to generate the report.
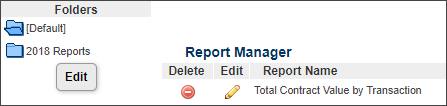
Report Manager Overview
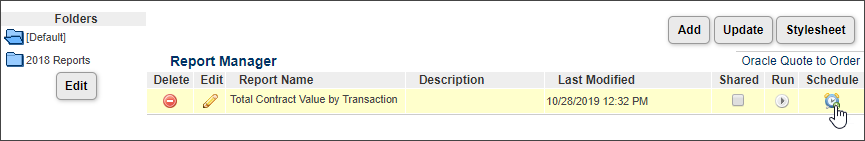
There is one Report Manager available for each Commerce Process. Using the Report Manager page, you can add, delete, edit, run, share, schedule and/or store reports.
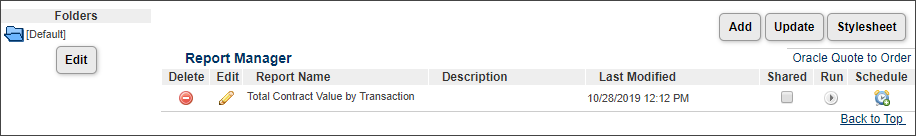
| Delete |
Click the delete icon next to the report(s) you wish to delete. Only self-created reports can be deleted. Shared reports must be deleted by the user that created them. |
| Edit |
Click the edit icon next to the report you'd like to edit. |
| Report Name |
Click the Report Name label to edit. |
| Description |
Write a description of the report by clicking the Description field. |
| Last Modified |
Time stamp for the last time the report was updated or edited and saved. |
| Shared |
Check this box so your report is available to all other users. |
| Run |
Click Run to generate the report. |
| Schedule |
Click the schedule icon to open the Schedule Report Editor. Then determine how often to run the reports and to whom they should be emailed. |
| Add |
Click Add to create a new report. |
| Update |
Click Update after making changes to the description or checking/unchecking the Shared option. |
| Stylesheet |
Click the Stylesheet to open the Reporting Stylesheet Editor. |
Administration
Prior to creating reports administrators must display report access links and create Data Columns for report attributes.
Display Reports to Users
Perform the following steps to display report access link in the navigation menu for the appropriate user types and groups.
-
Navigate to Admin > Style and Templates > Navigation Menus
The Navigation Menus page opens.
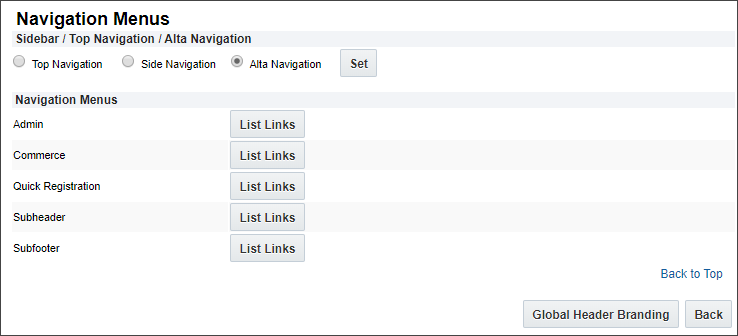
Since reporting is primarily focused on the sales transaction, reporting is performed with a ‘Report Manager’ that is specific to a Commerce Process. You can expose a link for each ‘Report Manager’ to the appropriate admin personnel.
-
Click on List Links for the Commerce Navigation Menu.
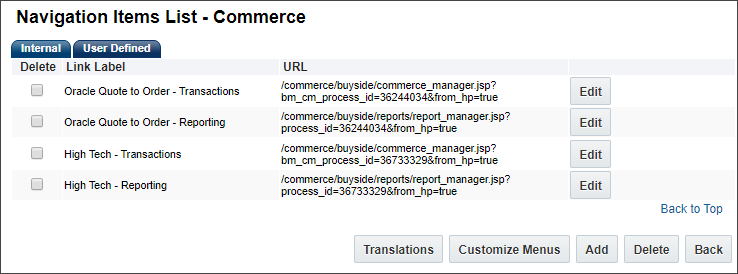
The Navigation Items List for Commerce opens.
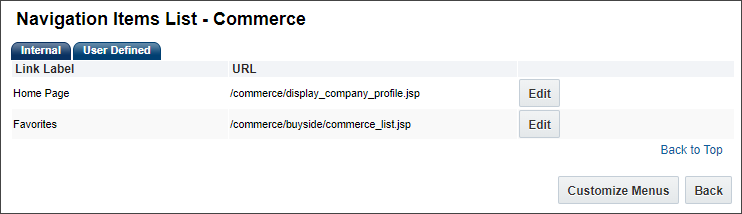
-
Select the User Defined tab.
There should be Transaction Manager and Report Manager links for each Commerce Process.
-
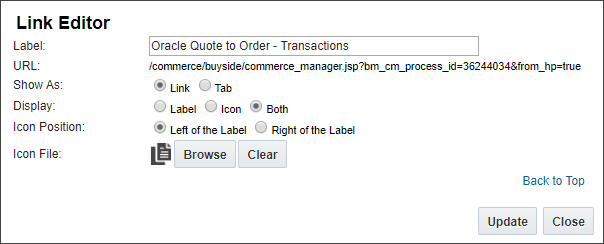
Click Edit to change the name, display options, or icon for the link (optional).
-
Click Customize Menus to display the Report Manager menu item to the appropriate users.
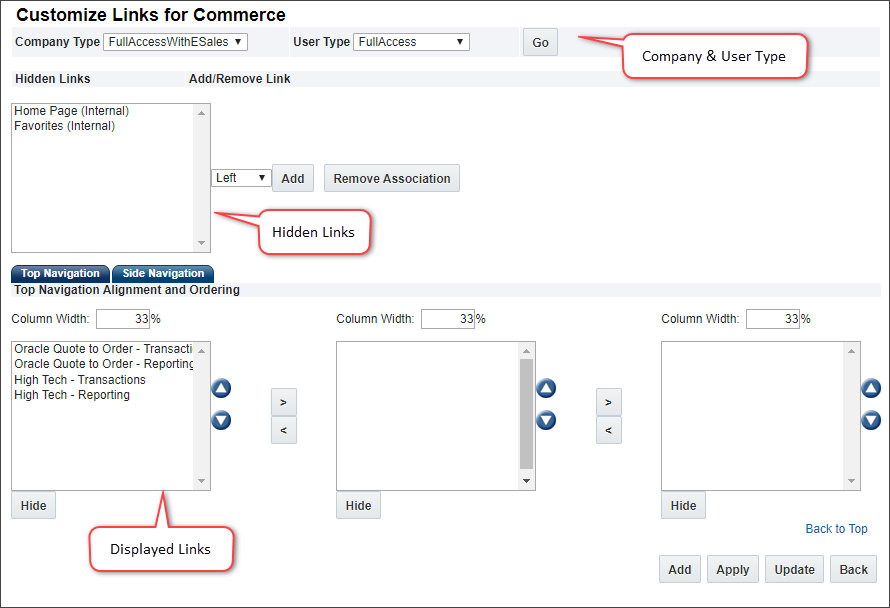
- The Company Type and User Type for each category of user can be selected at the top of this page.
When a User Type is selected, the settings below will govern whether the links are displayed or hidden.
- Hidden links are displayed in the middle of the page.
- Links displayed to users are shown in the bottom half of the page.
The following image shows links for theCompany Type 'FullAccessWithESales' and User Type 'FullAccess',
- Home Page (Internal) and Favorites (Internal) links are hidden.
- Oracle Quote to Order - Transactions, Oracle Quote to Order - Reporting, High Tech - Transactions, and High Tech - Reporting links are displayed.
-
To display a hidden link:
-
Select the appropriate link from the Hidden Links list, then click Add.
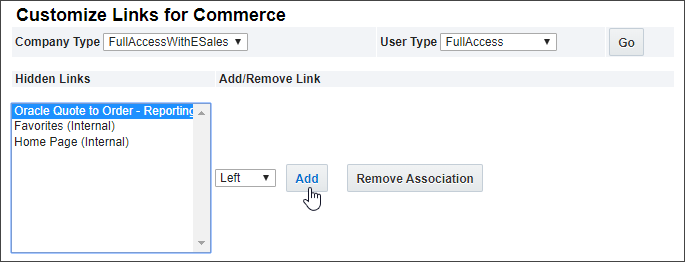
- Click Apply or Update to save the changes.
Create Data Columns for Report Attributes
Oracle CPQ stores it’s Commerce Documents (aka the Sales Transaction) as XML. This allows Oracle CPQ to be more flexible and extensible, but it also makes it difficult to query and report on data when it is formatted as XML. To efficiently query and report on Oracle CPQ data, the Report Managers and Transaction Managers (also know as Process Manager) need to have Oracle CPQ transaction data instantiated as relational database entries. This is accomplished by creating and populating Data Columns.
Your implementation most likely already has a number of Data Columns created and mapped to Process Manager and Transaction Manager columns which display transaction lists. You can use those Data Columns, and create new Data Columns for any additional data you want to report on.
Notes:
- Refer to the Data Columns topic for instructions to add new Data Columns.
- After creating a new Data Column, you will need to populate the data column for all transactions.
Add a Report
Perform the following steps to create a report.
-
Navigate to the Report Manager using the appropriate Navigation link or icon.
If the Report Manager navigation link is not displayed, refer to Display Reports to Users for instructions to display the Report link.
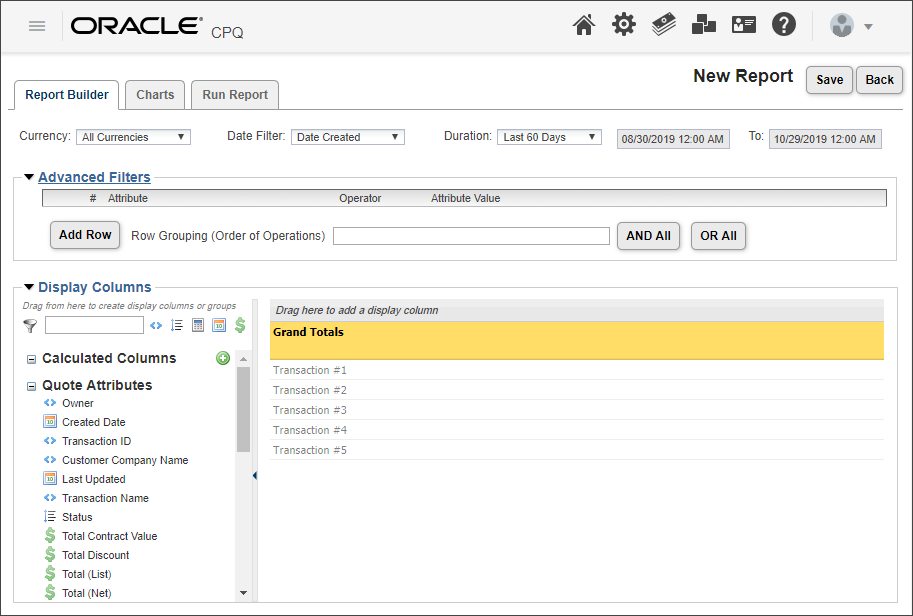
- Click Add, the Report Builder opens.
-
Add Currency and Date Filters
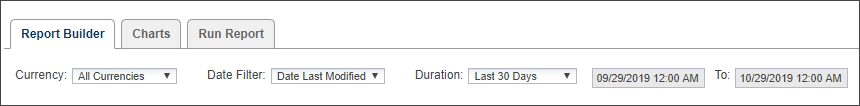
| Currency |
You can filter by document currency. Reports can return transactions in all currencies, as long as the user does not perform any operation, like sum, average, and so on, on a Currency type attribute, use that attribute in a calculated column, or use a Currency type attribute in a Group By. In these cases, the user must select a specific currency. |
| Date Filter |
This filter is mandatory. Standard dates that can be used to build reports are Date Created and Date Last Modified. Additionally, users can choose any custom commerce Date attributes that have been mapped to the Data Columns, such as Expiration Date. |
| Duration |
This filter is mandatory. You can choose the duration for the date chosen in the Date Filter. |
In relation to duration, remember that a week is considered to begin on a Sunday and end on a Saturday. You are allowed to set the beginning of a fiscal years in the Process Administration editor. All Fiscal durations will be based on this date.
-
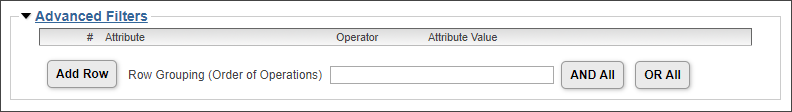
Add Advanced Filters
The user can define advanced filters on all main-document, sub-document and configurable Text, Numeric, Currency, Date and Menu type attributes that have been mapped to Data Columns.
-
Click Add Row.
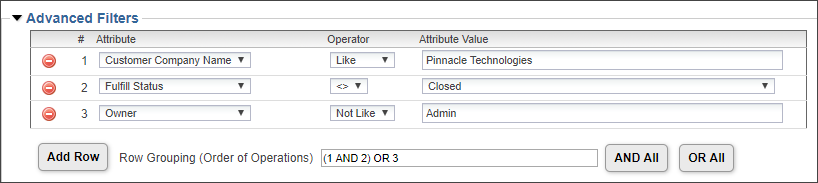
-
Click on the drop-down under Attribute and choose the attribute you'd like to filter by.
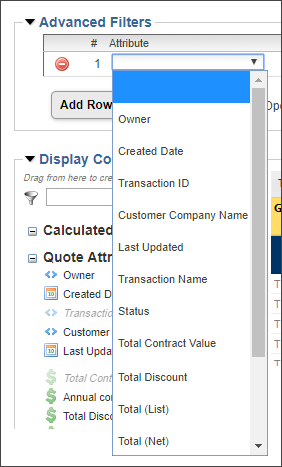
- Select the Operator and enter an Attribute Value.
-
Set the Row Grouping, for multiple attributes. If left blank it will default to AND ALL.
Blank values are supported in Filters just as they are supported in saved searches. However, the user cannot create a report without specifying an operator for a filter, unlike in saved searches.
-
Add Display Columns
Once you have created your filters, you will need to define at least one main-document display column in order to run the report.
-
Select an attribute from the Display Columns panel.
You can select from three options:
- Calculated Columns: This opens a BML-Like editor that allows you to write a script to define the output of the calculated columns.
- Quote Attributes: These are the same attributes available in Advanced Filters. All text, numeric, currency and date commerce attributes that are mapped to Data Columns.
- Line Item Attributes: These are the line(sub-doc) attributes that are mapped to Data Columns.
-
Drag the attributes onto the top of the report section:
- A green arrow next to the attribute name means that the attribute can be placed in the position you’ve selected.

- A red NO sign will appear next to the attribute if it is not allowed.
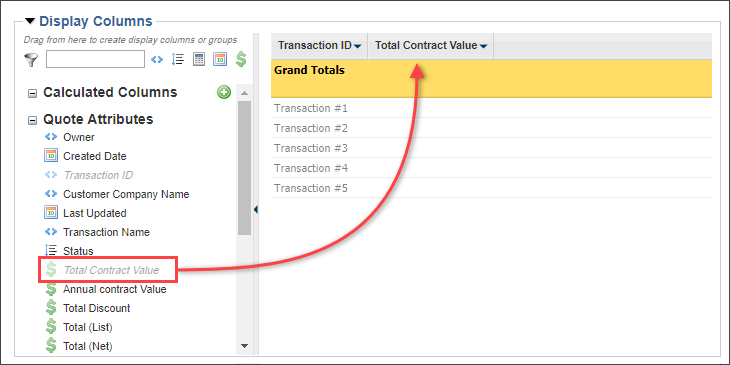
The order you place your columns is how they will appear on the report.
-
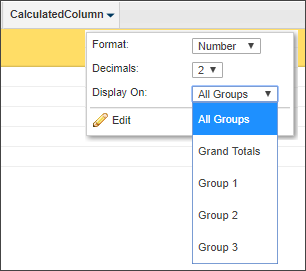
| Calculated Column |
|
Format: Switch between the Number and Currency formats. If the Number format is selected, another option will appear allowing you to set the number of decimal points.
Display On: Specify at which group level the column should be displayed.
Edit: Make changes to the calculated column.
|
For more information see, Calculated Columns |
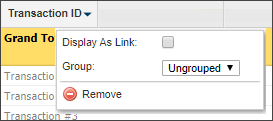
| Non-Numeric Quote and Line Item Attributes |
|
Display as Link: Displays the attribute as a link that when clicked, takes you to the quote.
Group: Determine if this attribute should be used to group the rows. Doing so will remove the attribute as a Display Column. For example, you can group quotes by their Submitted Date or by Selected Currency.
Remove: Click to remove the column from the Display Columns panel.
|
|
| Numeric Quote and Line Item Attributes |
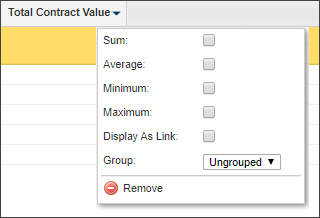
|
Sum: Reflect the sum of the aggregate for an attribute. For example, , Quote Totals.
Average: Reflect the average for an attribute.
Minimum: Reflects the minimum value of all Quote Totals for a group. If there are three quotes ($145,694.23, $34.56, and $35, 434), the minimum will find $34.56.
Maximum: Reflects the maximum value of all Quote Totals for a group. If there are three quotes ($145,694.23, $34.56, and $35, 434), the maximum will find $145,694.23.
|
All numeric quote and line item attributes have the ability to be displayed as aggregates. Aggregates are used in conjunction with Groups to provide data on the x-axis of charts. in this example, you will see the options for the attribute Quote Total. |
-
Grouping Report Attributes
Drag the attributes into the grouping section of the report.
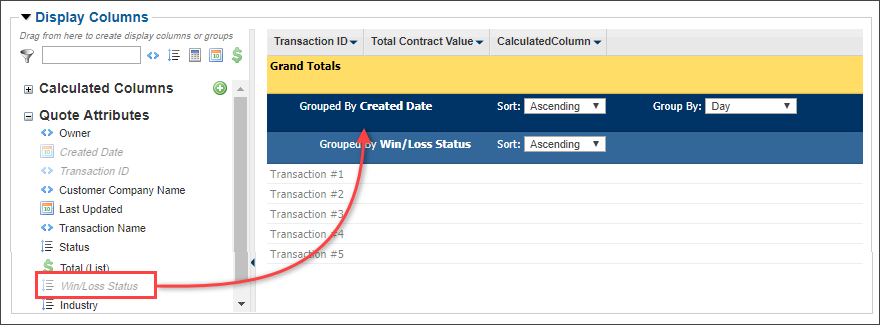
You will then be given the options to sort in Ascending or Descending orders. Depending on the attribute, you may also see options to Group By certain specifics.
- Click Save.
- Enter a name for the report, then click OK.
Grouping becomes very important if you plan to add charts to your report.
- Pagination of reports occurs at the group level.
- Results within a group will be sorted in ascending or descending order for text, menu, currency and numerical attributes. Additionally, by Duration for date attributes
All commerce attributes used in reporting must be mapped to Data Columns. HTML, RTE, File Attachment, composite attributes, history fields and approval-related attributes are not available for reporting.
Add a Folder
-
Click Edit under the Folders section within the Report Manager.
- Click Add Folder from the Admin Folders pop-up.
-
Enter the Folder Name in the text box.
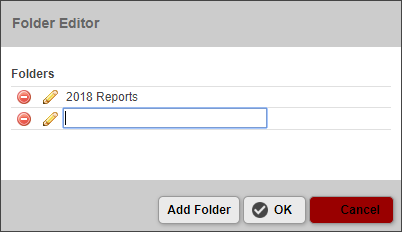
-
Click OK to save the change or Cancel to return to the Report Manager.
To edit a folder, click the pencil icon. To delete a folder, click the delete icon.
Schedule a Report
-
Click the schedule icon on the Report Manager page.
- Select an option, under Recurrence, based on how often you'd like the report to run.
-
Choose the day, week, month, and/or specific time or date for when you will run the report.
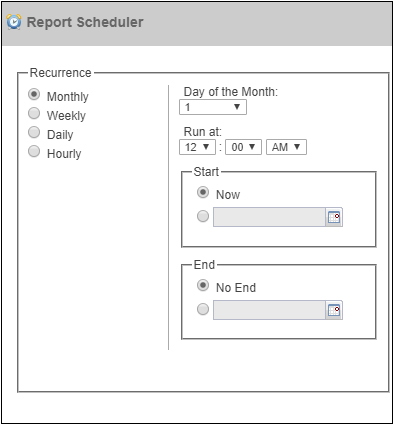
-
Enter the email credentials and a subject line for who should receive an email and a report attachment once the report is run.
Users can schedule a maximum of 10 reports at a time.
Run a Report
When you have finished creating your reports and charts, you can run the report.
-
Click Run from the Report Manager or, if you're in the Report Builder, click the Run Report tab in the header bar.
- Modify the Standard Filters by using the drop-downs for Date Filter (Date Created, Expiration Date, Date Last Modified, and so on) and for Date Duration (Custom, Last 30 Days, Current Quarter, and so on).
-
Click Run Report again to see the report and the chart that you created:
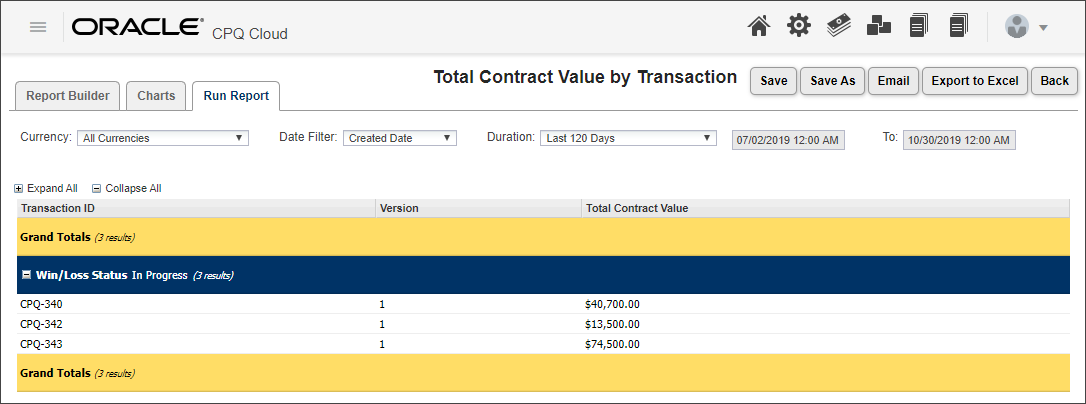
-
If the report that was generated meets your requirements, you can save, email, or export the report to Excel. The report actions are located just next to the report name.
-
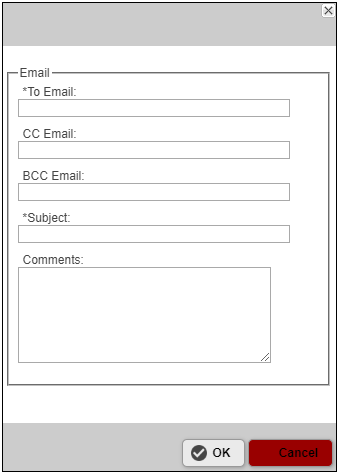
Click Email. The following dialog appears:
-
Complete the two required fields (marked by an *) and click OK to email your report and chart. The file is sent as an attachment in Excel format.
The user can open transactions when Display Columns are shown as links.
Troubleshooting
Reporting Limits
There are a few limits to be aware of when using Native Reporting.
Notes
- Reporting is included in the Enterprise and Premium editions of CPQ. It is not available in the Standard edition of CPQ. Contact your Oracle CPQ application sales representative for more information.
- The fields that are not available for reporting are Composite Summation, Attachment, Rich Text/description over 255 characters, multi-select menus, read-only HTML fields and all configuration attributes.
- Report results depend on user permissions. If a quote is in a particular step and is hidden from a certain user, that user will not be able to view the transaction in the report results.
- Only 2,000 records can be shown on the UI. The user must download the results to view more than 2,000 results.
- Reports can also be run by passing in a blank value as criteria for the filter attributes. In that case, all records are returned.
Related Topics
See Also


