Calculated Columns
Overview
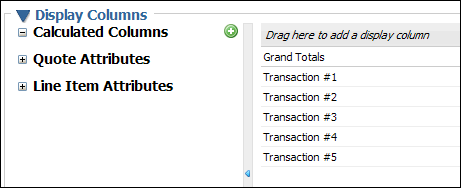
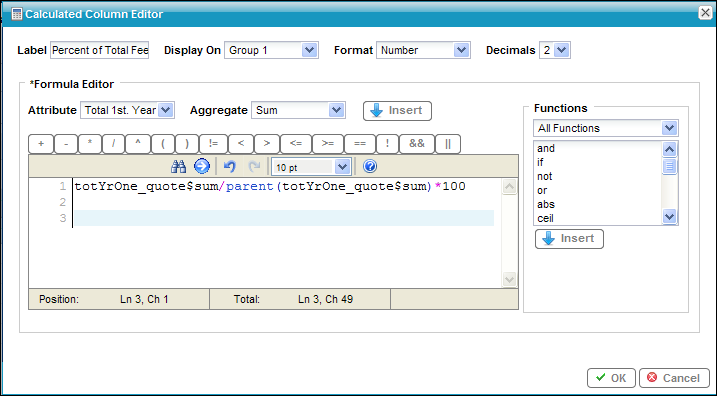
You can create your own calculated columns within the Report Builder. To create a calculated column, click the Add icon next to the Calculated Columns label found under Display Columns.
Administration
- Enter a Label name on the Calculated Column Editor.
- Determine if the calculation should be displayed next to a particular group, All Groups or Group Totals.
-
Determine the Format of the column: Number or Currency.
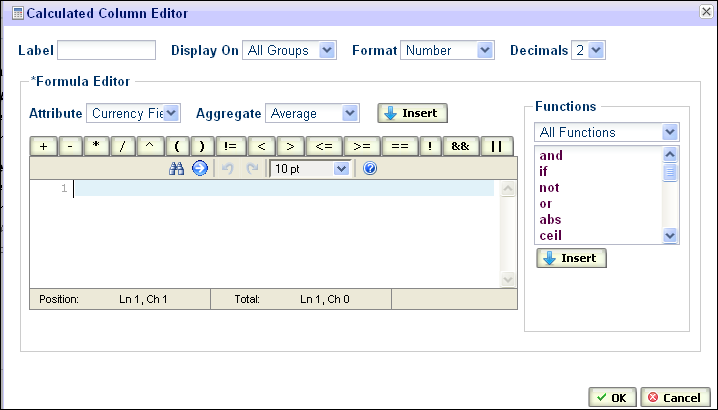 If you choose number, make sure to select between 0-4 allowed decimal places.
 -
Choose the attribute(s) that you would like to include in your calculation. This is found in the Formula Editor section.
The attributes that are in this list are the numeric or currency attributes that you have mapped to Data Columns. - Choose the aggregate that you will use to calculate the column (for example, Average, Count, Sum, Minimum, Maximum).
- Click Insert to add the attribute and aggregate to the script editor.
- Use the operator buttons above the script editor to help create your calculation.
-
Choose a Logical, Mathematical or Summary function to add to the calculation from the drop-down and click Insert.
- Click OK when you have finished creating the calculation to save it.
Use Cases
![]() Use Case: Percentage of Total Fees
Use Case: Percentage of Total Fees
| What Am I Doing? | How Do I Do It? | What Does it Look Like? |
|---|---|---|
| Fees based on Quote Status (Group 1) |
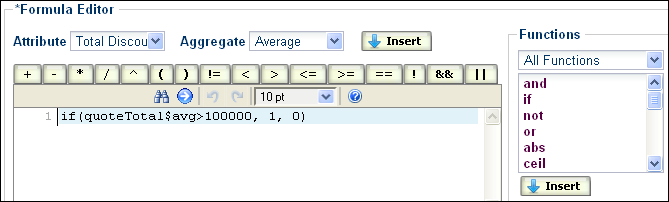
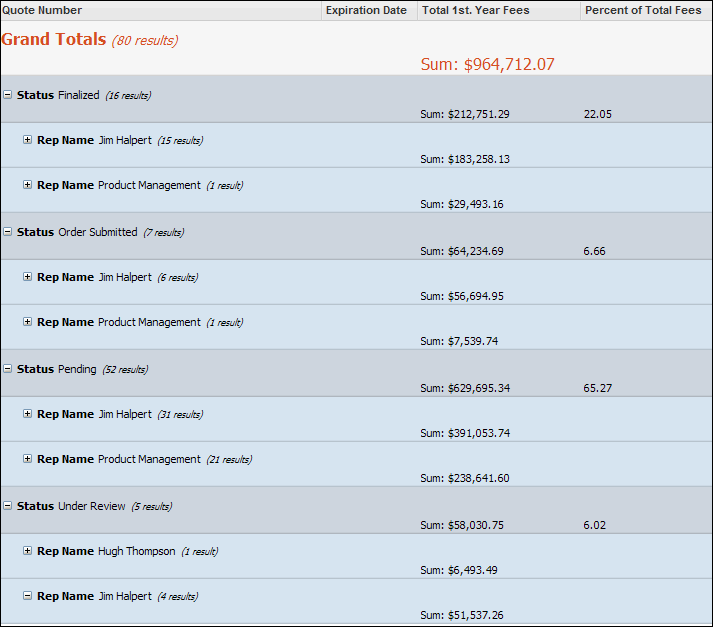
In this example, we'd like to display the percentage of the attribute "Total First Year Fee's" for each quote status. Since the quote status is in Group 1, this is where we'd like this calculation to be displayed. Notice that we are dividing the Total 1st Year Fees by the Parent level of Total first Year Fees and then multiplying by 100 to get a percentage. |
|
| Based on Rep Name (Group 2) |
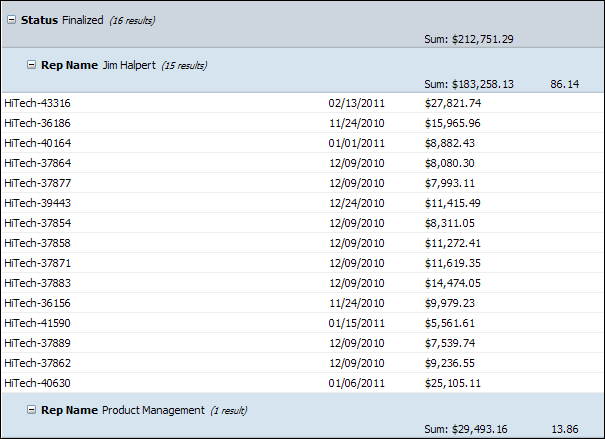
Let's say you wanted to see the percentage of total first year fee's based on Rep Name. The rep name is in Group 2, a sub-level of Group 1 (Status). Since Status is the "parent" of Rep Name, you'll notice that the percentages shown by the rep name add up to 100% of each Status. |
|
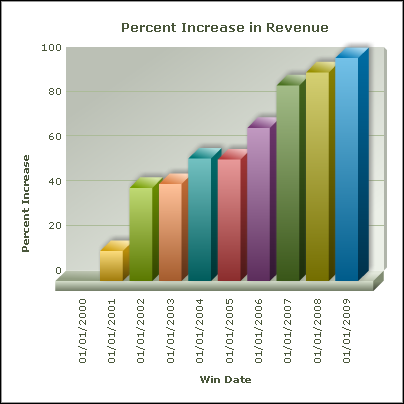
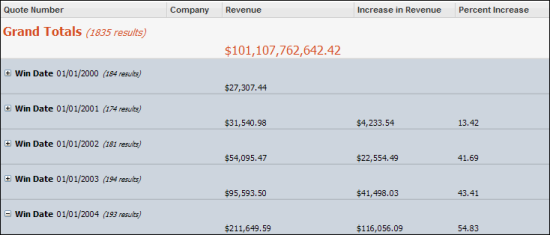
In this example, we'd like our report to display the total annual revenue, increase in revenue and percentage of that change.
| What Am I Doing? | How Do I Do It? | What Does it Look Like? |
|---|---|---|
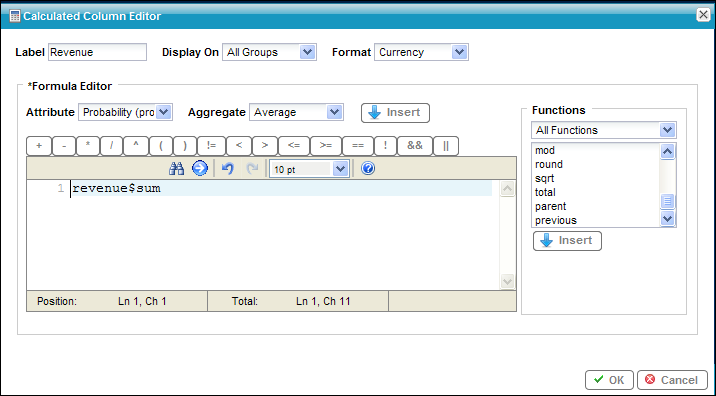
| Calculating Revenue | The first column that is displayed is a calculated column named Revenue. This should be displayed on All Groups level and we want it to display as a Currency. We will select the attribute "Revenue" and the aggregate "Sum" and insert it into the script editor. This will give us the sum of all revenue for all groups. |
|
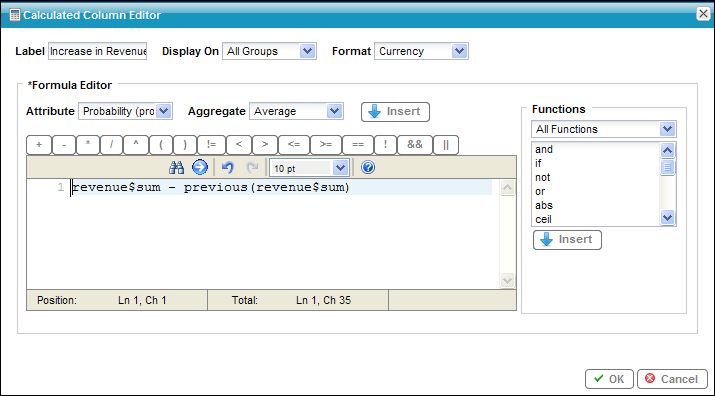
| Calculating Increase in Revenue ($) | To calculate the increase in revenue, we'll take the calculation from above and subtract the previous year's revenue total by using the 'previous' function. Make sure the number Format is 'Currency'. |
|
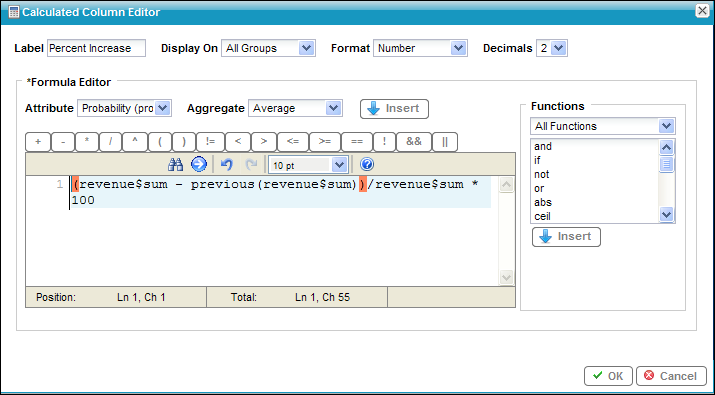
| Calculating Increase in Revenue (%) |
To complete the report, we'll take the calculation from above and divide it by sum of all revenue and multiply it be 100 to get a percentage. Make sure that the Number format is used here. |
|
![]() Use Case: Average Time Between Approvals
Use Case: Average Time Between Approvals
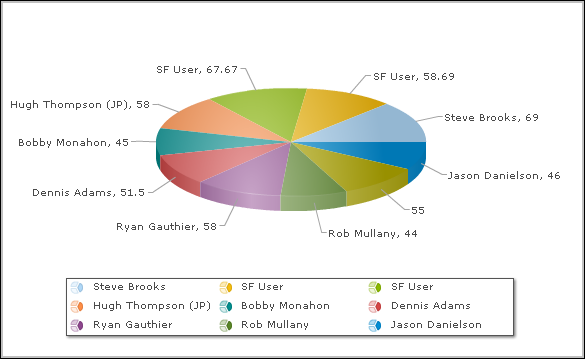
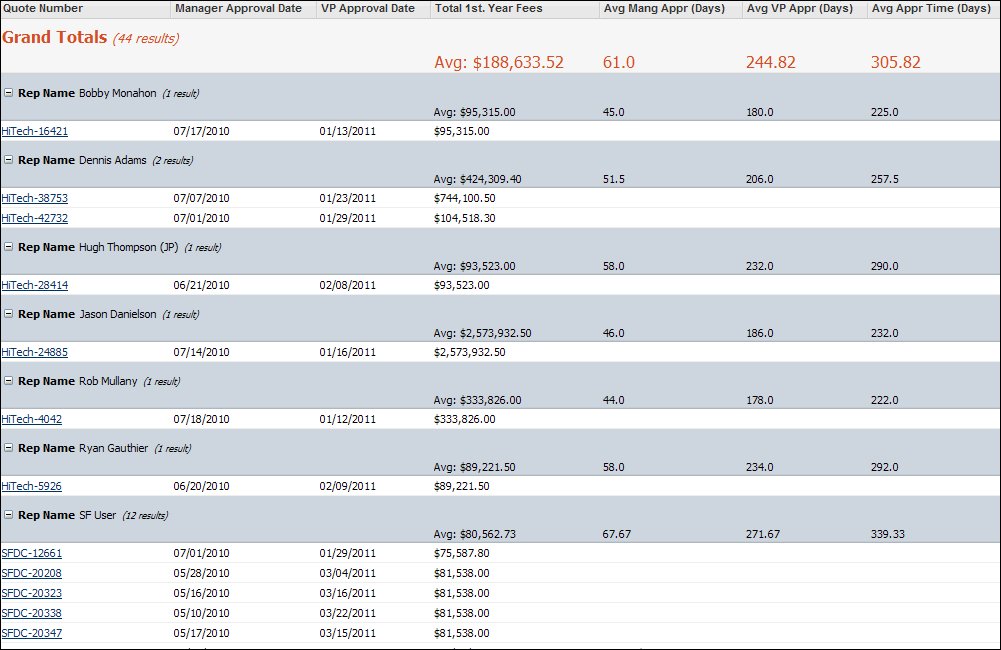
You can use calculated columns to create report that shows the average time it takes for a quote to be approved. In this case, the chart is displaying the results of the average days it takes a manager to approve a quote based on who the sales rep is.
| Approval | How Do I Do It? | What Does it Look Like? |
|---|---|---|
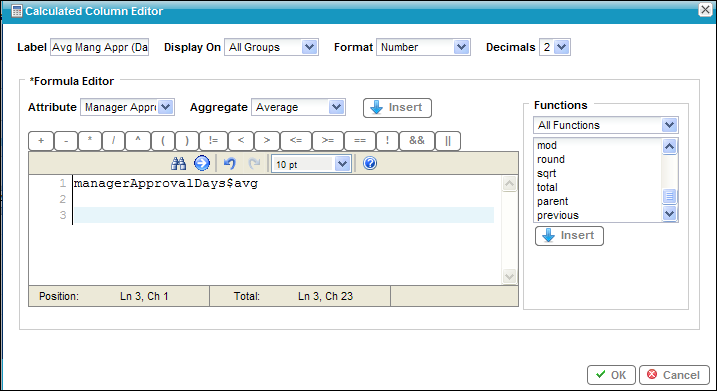
| Average Manager Approval | Select the attribute "Manager Approval Days" from the Attribute drop downbound menu and select the Aggregate "Average". |
|
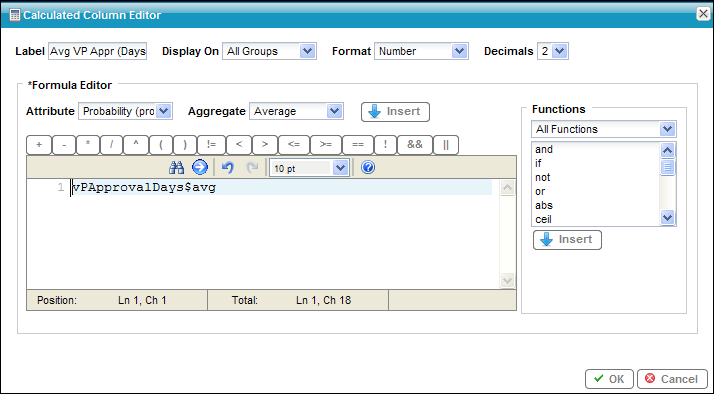
| Average VP Approval | Select VP Approval Days from the Attribute drop-down and select the Aggregate "Average". |
|
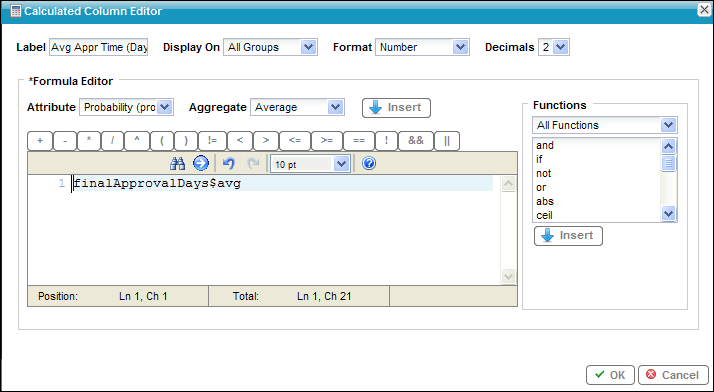
| Average Final Approval | Select "Final Approval Days" from the Attribute drop-down and select the Aggregate "Average". |
|


