Time Series Analytic
Overview
While negotiating pricing on a deal, it is very helpful to know the price trend for a customer, market, or product. With these trends in mind, sales users can craft their quote prices and discounts to be both more competitive and more profitable. One specific use case occurs when negotiating with a repeat customer. Knowing the discounts and prices paid by this customer in the past allows the negotiator to anticipate the customer’s expectations and better counter demands for additional discounts.
Oracle CPQ 22C introduces the new Time Series Analytic to display Transaction and Transaction Line pricing trends to sales representatives during the quoting process. This is a type of data visualization that displays data points as a comparison set in a chart. The Time Series Analytic is also useful for pricing managers and approvers in deciding to approve or reject special pricing requests.
Transaction Time Series Analytic
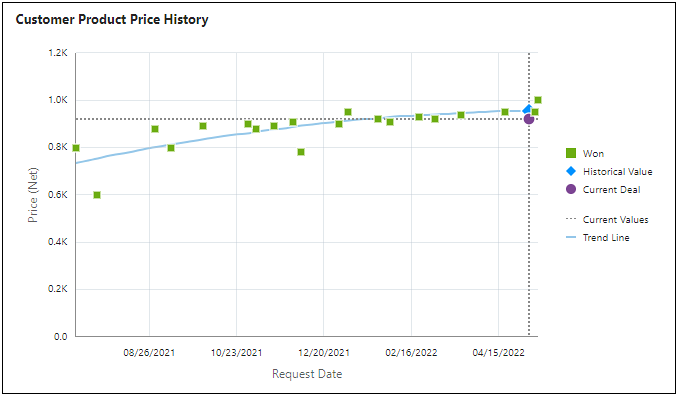
The following analytic shows the pricing trends for customer discounts.
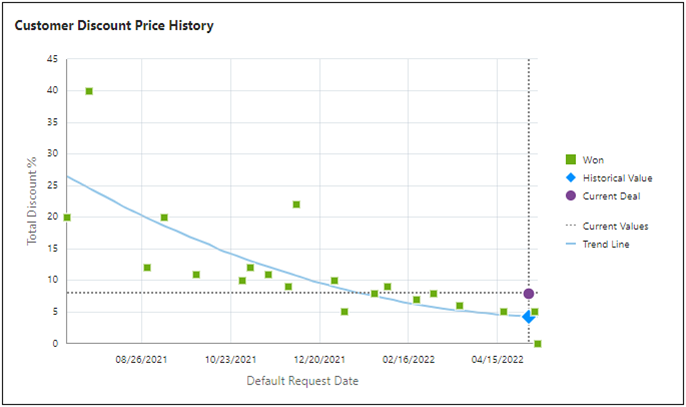
 Current Deal Data Point
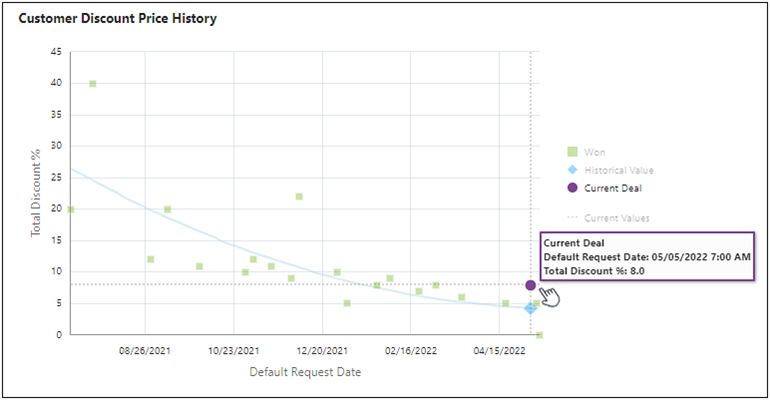
The Current Deal information is displayed as a circular purple symbol. When a user hovers over the Current Deal data point, information for the current deal is displayed. Sales users can better visualize the relationship of the current deal to historical deals and the historical trend line. When the sales user hovers over the Current Deal data point in the following image, they can see that the Total Discount % for the current deal is slightly higher that the trending discount.
Won Data Point
The Won deal information is displayed as a square green symbol. When the sales user hovers over a Won data point, the Request Date (defined x-axis value) and Total Discount % (defined y-axis value) are shown. In the selected deal shown below, the Total Discount % is substantially higher than the trending discount.
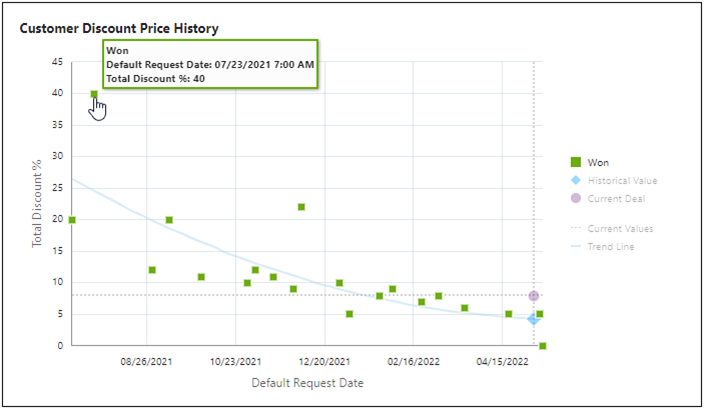
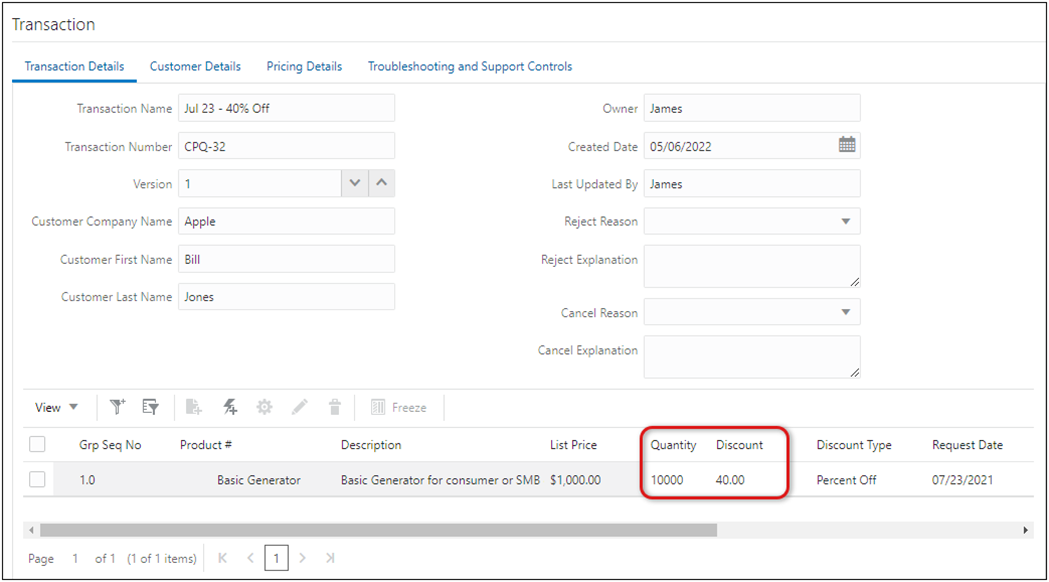
The sales user can click on the data point to open the associated transaction if they want to view more details to help identify why the discount is so high for this deal. When the associated transaction opens, the sales user can see that the customer received a large discount because they ordered 10,000 items.
Note: Lost and In Progress deals can also be included, but are not included in the primary use case for understanding trends for closed deals.
Transaction Line Time Series Analytic
The Transaction Line Time Series Analytic will display pricing trends when the sales user opens the Transaction Line Details page. The following analytic shows the pricing trend for the item net price.
Administration
Create a Time Series Analytic
The Time Series Analytic displays Transaction and Transaction Line pricing trends to sales representatives during the quoting process.
Complete the following steps to create a Time Series Analytic
- Navigate to the Admin Home Page.
- Click Process Definition in the Commerce and Documents section.
- Select Analytics from the Navigation drop-down menu, then click List.
- Click Create Analytic. The Analytic wizard opens.
-
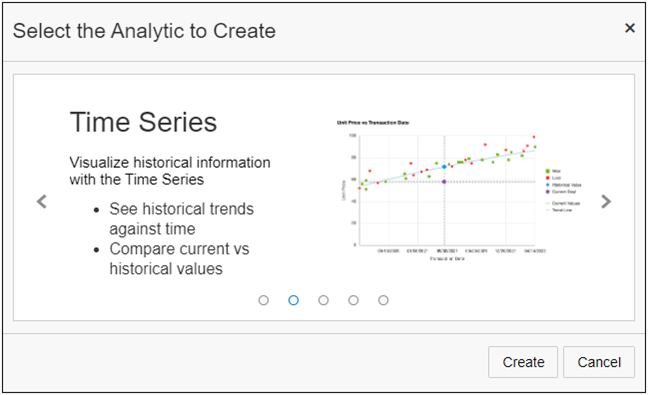
Scroll through the filmstrip to the Time Series option, then click Create.
- Define the analytic properties:
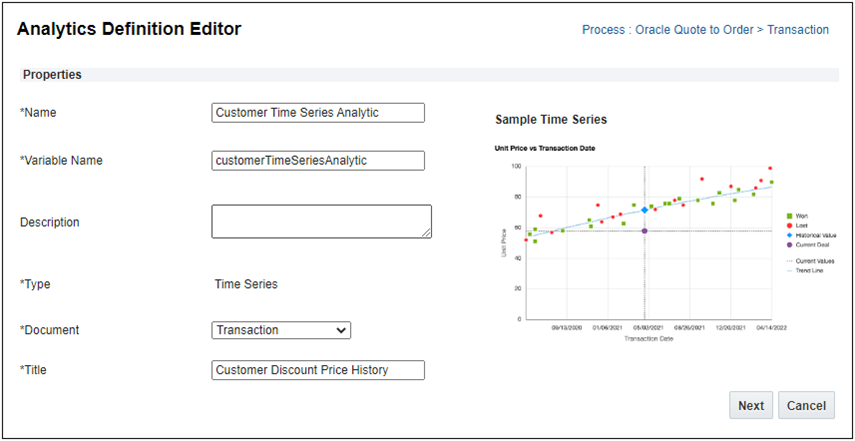
- Click Next.
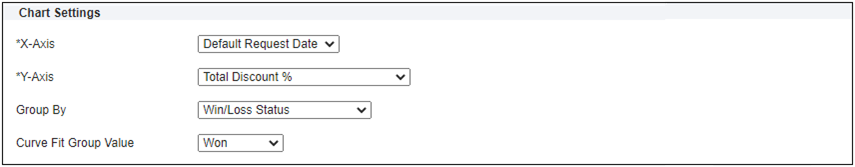
- Define Chart Settings:
X-Axis - select the date-type data column or system attribute to be represented on the x-axis.
(e.g. Request Date) This selection will also be the x-axis name on the chart.
Y-Axis - select the numeric-type data column attribute to be represented on the y-axis.
(e.g. Total Discount %) This selection will also be the y-axis name on the chart.
Group By (optional) - select how deals will be displayed on the chart. The selected attribute's values will be used to display using a different icon.
Typically you will want to use a won/loss status for this grouping.
Curve Fit Group Value (optional) - select the curve fit value if "Group By" is used (e.g. Won).
Deals with the selected "Group By" value will be used to fit the regression line pattern that will be displayed in blue on the chart to reflect the historical pattern.
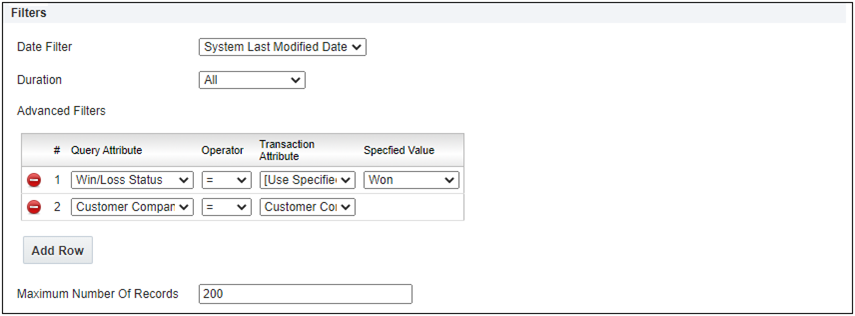
- Define Filters:
-
Date Filter - The name of the Commerce date attribute used to filter historical Transactions for the analysis.
System attributes such as 'System Last Modified Date' may also be selected.
-
Duration - The time period prior to today's date to include in the analysis. The data selection duration is cumulative.
Administrators may select from options including Last 30 days, Last 90 days, Last 6 months, Last 12 months, Last 24 months, and All Transactions.
-
Advanced Filters allow administrators to limit the results displayed in Transaction and Transaction Line Time Series Analytics.
To simplify understanding for users, you may want to filter out in progress and lost deals so that only won deals are displayed.
- Click Add Row to add additional items to filter. There can be an unlimited number of filters for each Time Series Analytic.
- Select Query Attributes from predefined Data Columns.
-
Select the Operator used to match the selected criteria.
Operators relevant to the query data type display to enable administrators easy and accurate editing of filters. Attributes without values can also be filtered out using the 'Is Empty' and 'Is Not Empty' operators, providing administrators with flexibility to assure that only clean data is included in their predictive model.
-
If applicable, select Transaction Attributes or [Use Specified Value].
-
If applicable, select or define the Specified Value to be used in the query filter.
Select a value from a drop-down list for Menu or Boolean attributes, a date for Date attributes, or enter a value for Text or Numeric attributes.
For example, Time Series Analytics can display only data for the same industry or customer present on the current Transaction.
-
Enter a Maximum Number of Records value.
The default value for Maximum Number of Records is "200". If a value is not specified a maximum of "1200" records will be used.
Note: Enter the least number of Maximum Number Of Records acceptable for your business need.
- The maximum number of records is defaulted to 200, and cannot exceed 1,200.
- Once the storage limit is reached, the least recently used entries are removed from the cache to make space for new data point entries.
-
Optional, select the Enable Cache checkbox.
Before you enable cache, evaluate the caching effectiveness for the analytic. Caching is most effective if the analytic is shared among quotes and sales users. For example, a discount vs revenue Time Series Analytic by sales regions is a good candidate for caching, as it is the same for all sales users in the same region. On the other hand, if every quote or sales user would see a different Time Series Analytic (for example, quote history of the current sales user), caching is unlikely to be effective. Instead, in this example, you may want to set the HTML attribute to "Leave Value Unchanged" in its Modify tab. This prevents the HTML attribute from refreshing in the corresponding modify actions.
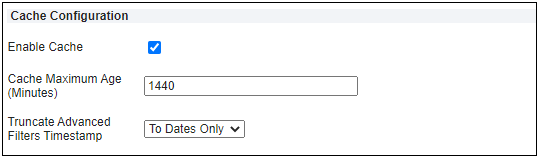
- Enter the number of minutes to retain the data point values in the cache before the values are refreshed from the database. The default is "1440" Minutes. The minimum value is "1" and maximum value is "7200" Minutes.
- Select a value from the Truncate Advanced Filters Timestamp drop down to define the granularity (days or hours) of date-time attributes used to access cached data:
- To Dates Only - Truncate Advanced Filters Timestamp attributes to date only and ignoring hours, minutes and seconds when data points are cached.
- To Hours Only - Truncate Advanced Filters Timestamp attributes to include date and hour, ignoring minutes and seconds when data points are cached.
- Select one of the following options:
- Click Apply to save changes and remain on the Editor page
- Click Update to save changes and return to the Analytics list page.
- Click Update and New to define another analytic.
- Click Back to return to the Analytics list page without saving changes.
Copy Analytics
Administrators can copy Scatter Plot, Win Probability, Price Optimization, or Price Guidance analytics. This functionality allows administrators to quickly define and preview alternative analytics to evaluate the results with differing inputs.
Complete the following steps to copy an analytic:
- Navigate to the Admin Home page.
-
Under Commerce and Documents, click Process.
The Processes page opens.
- Select Analytics from the Navigation menu, next to the applicable process.
-
Click List.
The Analytics List page opens.
-
Select the checkbox next to the applicable analytic.
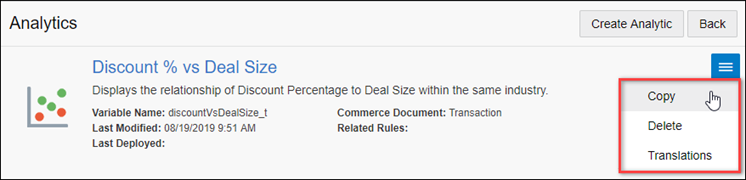
-
Click Copy.
The Analytics Definition Editor page opens.
- Update the analytic properties as desired.
- Initiate machine learning to train the new analytic.
- Preview the new analytic to analyze the results.
Note: Training sessions and results, and analytic output actions and attributes are not copied as part of the cloning process.
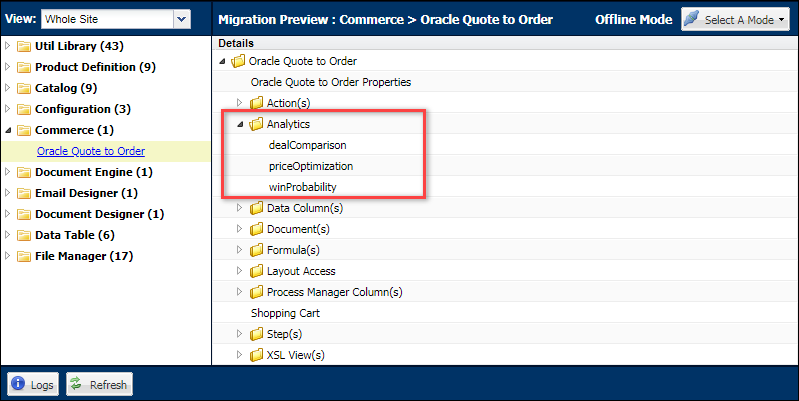
Migrate Deal Management Analytics
The Migration Center is the user interface where all migration takes place within Oracle CPQ. Deal Management Analytics are displayed in the Analytics folder under the applicable Commerce process. Deal Management Analytics are migrated when the parent Commerce process is migrated.
Notes
Notes:
- Win Probability, Price Optimization, Price Guidance Gauge, Deal Comparison Scatter Plot, and Time Series HTML attribute data is not printed in Document Designer and Email Designer outputs.
- Commerce attributes used in the analytic must exist as Data Columns.
Custom Variable Name Conventions
In Oracle CPQ 23D, CPQ adopted Oracle CX Sales variable naming conventions for custom items. When an administrator creates a new custom Commerce item, the "_c" suffix is appended to the variable name. The new naming convention for custom variable names provides more consistency for integrations with Oracle Sales.
Beginning in Oracle CPQ 24C, customers can submit a service request to disable the "_c" suffix on variable names for custom Commerce entities (Actions, Analytics, Attributes, Data Columns, Integrations, Library Functions, Rules, Steps, etc.). The "_c" suffix is enabled by default for standard and legacy Commerce processes.
- Customers can submit a Service Request (SR) on My Oracle Support to disable the "_c" suffix on variable names for custom Commerce entities
- When the "_c" is disabled, the "_c" variable name suffix will not be required for newly created custom Commerce entities.
- Disabling the "_c" variable name suffix for custom Commerce entities will not change existing variable names.
- The "_c" suffix setting will not impact existing variable names when cloning a Commerce process or migrating Commerce items. Target variable names will be the same as the variable names from the source Commerce process.
Related Topics
See Also


